in the post will reviewed a number of metrics for evaluating classification and regression models. For that we use the functions we use of the sklearn library. We’ll learn how to generate model data and how to train linear models and evaluate their quality.
Category: Data Mining
In this post we’ll show how to build regression linear models using the sklearn.linear.model module.
See also the post on classification linear models using the sklearn.linear.model module.
The code as an IPython notebook
In this post we’ll show how to build classification linear models using the sklearn.linear.model module.
The code as an IPython notebook
The Regularization is applying a penalty to increasing the magnitude of parameter values in order to reduce overfitting. When you train a model such as a logistic regression model, you are choosing parameters that give you the best fit to the data. This means minimizing the error between what the model predicts for your dependent variable given your data compared to what your dependent variable actually is.
See the practical example how to deal with overfitting by the regularization.
In the post we’ll get to know the Cross-validation strategies as from the Sklearn module. We’ll show the methods of how to perform k-fold cross-validation. All the iPython notebook code is correct for Python 3.6.
The iPython notebook code
In the post we will show how to generate model data and load standard datasets using the sklearn datasets module. We use sklearn.datasets in the Python 3.
The code of an iPython notebook
In this post we’ll show how to make a linear regression model for a data set and perform a stochastic gradient descent in order to optimize the model parameters. As in a previous post we’ll calculate MSE (Mean squared error) and minimize it.
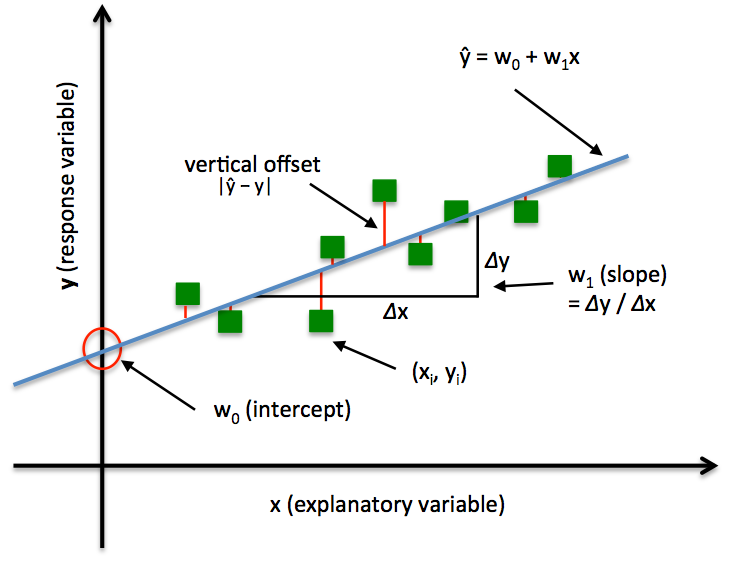
In this post we’ll share with you the vivid yet simple application of the Linear regression methods. We’ll be using the example of predicting a person’s height based on their weight. There you’ll see what kind of math is behind this. We will also introduce you to the basic Python libraries needed to work in the Data Analysis.

The iPython notebook code
In the post we share some basics of classification and clustering in Machine learning. We also review some of the cluster analysis methods and algorithms.
In this post we share how to plot distribution histogram for the Weibull ditribution and the distribution of sample averages as approximated by the Normal (Gaussian) distribution. We’ll show how the approximation accuracy changes with samples volume increase.
One may get the full .ipynb file here.
