
In this post we’ll show how to build classification linear models using the sklearn.linear.model module.
The code as an IPython notebook
Linear models
sklearn.liner_model – documentation on sklearn.linear_model
linear_model examples:
- RidgeClassifier
- SGDClassifier
- SGDRegressor
- LinearRegression
- LogisticRegression
- Lasso
All the examples of sklearn.linear_model
Module metrics is needed to evaluate the quality of aquired models.
import warnings
warnings.filterwarnings("ignore")

from matplotlib.colors import ListedColormap
from sklearn import model_selection, datasets, linear_model, metrics
import numpy as np
%pylab inline
1. Data generation
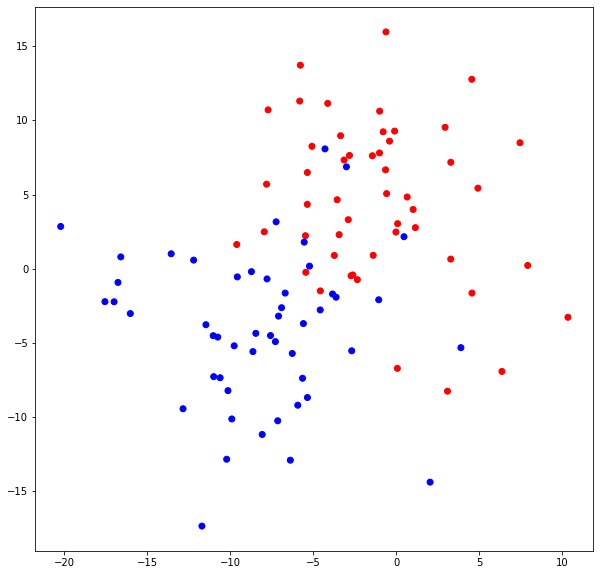
We choose a dataset of 2 features, labels forming 2 clouds.
- centers – number of classes
- cluster_std – standart deviation
blobs = datasets.make_blobs(centers = 2, cluster_std = 5.5, random_state=1)
Let’s visualize datasets in colors.
colors = ListedColormap(["red", "blue"])
pylab.figure(figsize(10, 10))
pylab.scatter([x[0] for x in blobs[0]], [x[1] for x in blobs[0]], c=blobs[1], cmap=colors)
Now we split the blobs dataset into the train and test sets.
train_data, test_data, train_labels, test_labels \
   = model_selection.train_test_split(blobs[0], blobs[1], \
   test_size = 0.3, random_state = 1)
2.1 RidgeClassifier
We’ll create/build the linear classifier named RidgeClassifier.
ridge_classifier = linear_model.RidgeClassifier(random_state = 1)
We train the classifier object: pass to it the train data and the train labels generated earlier.
ridge_classifier.fit(train_data, train_labels)
RidgeClassifier(random_state=1)
Now we check how well the classsifier has been trained.
We apply the test data to get predictions.
ridge_predictions = ridge_classifier.predict(test_data)
Now we output the test labels (response values) and the predicted labels, ones generated by the classifier.
print("Actual labels:\n", test_labels)
print("\nPredicted labels:\n", ridge_predictions)
Actual labels:
 [0 0 0 1 0 0 0 0 0 1 0 1 0 1 1 1 0 0 0 1 0 0 0 1 1 1 1 0 0 1]
Predicted labels:
 [0 0 0 1 0 1 0 0 0 1 0 1 0 1 1 1 1 0 1 1 1 0 0 1 1 1 1 0 0 1]
Rating model
We now rate the classification model quality.
round(metrics.accuracy_score(test_labels, ridge_predictions), 2)
0.87
We output the features weights and intercept for the following approximation function:
y(x1, x2) = w0 + w1 * x1 + w2 * x2print("[w1, w2]:", ridge_classifier.coef_ )
[w1, w2]: [[-0.0854443 -0.07273219]]
print("[w0]:",ridge_classifier.intercept_ )
[w0]: [-0.31250723]
2.2 Logistic Regression
The Logistic Regression is another model that we’ll train with the labeled data.
Create a classifier with the default parameters. Some of them are shown below:
- penalty = L2. Taken as a parameter of regularization.
- tolerance = 0.0001
log_regressor = linear_model.LogisticRegression(random_state = 1)
We train the set with the method fit().
log_regressor.fit(train_data, train_labels)
LogisticRegression(random_state=1)
We get predictions of the trained model. Besides prediction labels, the logistic regression build the probability model. That means that it may return a probability with which each object belongs to a certain class. Method predict_proba() returns the probability array.
lr_predictions = log_regressor.predict(test_data)
lr_proba_predictions = log_regressor.predict_proba(test_data)
print("Actual labels:\n", test_labels)
print("\nPredicted labels:\n", lr_predictions)
Actual labels:
 [0 0 0 1 0 0 0 0 0 1 0 1 0 1 1 1 0 0 0 1 0 0 0 1 1 1 1 0 0 1]
Predicted labels:
 [0 1 1 1 0 1 0 0 0 1 0 1 0 1 1 1 1 0 1 1 1 0 0 1 1 1 1 0 0 1]
We output the probability predictions. For each object we get 2 probability values. These define probability if it pertains to label “0” or “1”.
print(lr_proba_predictions[:10])
[[9.99254667e-01 7.45333217e-04]
 [4.08279523e-01 5.91720477e-01]
 [4.90541791e-01 5.09458209e-01]
 [3.78296027e-03 9.96217040e-01]
 [7.32221196e-01 2.67778804e-01]
 [2.44262899e-01 7.55737101e-01]
 [9.93761113e-01 6.23888724e-03]
 [9.78405579e-01 2.15944205e-02]
 [9.55344987e-01 4.46550128e-02]
 [1.68318566e-01 8.31681434e-01]]
We now rate the Logistic regression and RidgeClassifier models; compare quality.
print("Logistic regression", round(metrics.accuracy_score(test_labels, lr_predictions), 3))
print("\nRidgeClassifier:", round(metrics.accuracy_score(test_labels, ridge_predictions), 3))
Logistic regression 0.8
RidgeClassifier: 0.867
3. Quality assessment of cross-validation
3.1 Evaluate a score by cross-validation
The library provides a useful function cross_val_score() to evaluate a score of method by cross-validation.
- [trained] method: ridge_classifier
- data: blobs[0]
- labels: blobs[1]
- metric, scoring parameter. ‘accuracy’ – 1/N*∑[a(xi)==yi]
- cv denotes a cross-validation splitting strategy. cv is the K parameter in the KFold strategy.
ridge_scoring = model_selection.cross_val_score(ridge_classifier, blobs[0], blobs[1], scoring = "accuracy", cv = 10)
lr_scoring = model_selection.cross_val_score(log_regressor, blobs[0], blobs[1], scoring = "accuracy", cv = 10)
print("RidgeClassifier:\n", ridge_scoring)
print("\nLogistic regression scoring:\n", lr_scoring)
RidgeClassifier:
 [0.8 0.9 0.9 0.9 1.  1.  0.7 0.9 0.9 0.8]
Logistic regression scoring:
 [0.8 0.9 0.9 0.9 1.  1.  0.7 0.9 0.9 0.8]
Let’s view the scoring statistics:
print("Ridge mean:{}, max:{}, min:{}, std:{}"\
    .format(round(ridge_scoring.mean(), 3), ridge_scoring.max(), \
    ridge_scoring.min(), round( ridge_scoring.std(), 3)))
Ridge mean:0.88, max:1.0, min:0.7, std:0.087
print("Log mean:{}, max:{}, min:{}, std:{}"\
    .format(round(lr_scoring.mean(), 3), lr_scoring.max(), \
    lr_scoring.min(),  round( lr_scoring.std(), 3)))
Log mean:0.88, max:1.0, min:0.7, std:0.087
3.2 Evaluate a score by cross-validation with specified scorer and cv_strategy
Suppose we want to score a non-standart metric and we want to specify the cross-validation strategy.
We first define a scorer and specify cross-validation stratagy:
scorer = metrics.make_scorer(metrics.accuracy_score)
cv_strategy = model_selection.StratifiedShuffleSplit(n_splits=20, test_size = 0.3, random_state = 2)
cv_strategy.get_n_splits(blobs[1])
20
ridge_scoring = model_selection.cross_val_score(ridge_classifier, \
 blobs[0], blobs[1], scoring = scorer, cv = cv_strategy)
lr_scoring = model_selection.cross_val_score(log_regressor, \
 blobs[0], blobs[1], scoring = scorer, cv = cv_strategy)
print("Ridge mean:{}, max:{}, min:{}, std:{}"\
   .format(round(ridge_scoring.mean(), 3), ridge_scoring.max(), \
    ridge_scoring.min(), round( ridge_scoring.std(), 3)))
Ridge mean:0.87, max:1.0, min:0.7666666666666667, std:0.06
print("Log mean:{}, max:{}, min:{}, std:{}"\
    .format(round(lr_scoring.mean(), 3), lr_scoring.max(), \
    lr_scoring.min(),  round( lr_scoring.std(), 3)))
Log mean:0.87, max:1.0, min:0.7666666666666667, std:0.061